Azure Log Analytics for CosmosDB
How to enable and use Azure Log Analytics for Cosmos DB. Diagnostic settings, KQL queries, and enabling full-text query logging.
Cosmos DB allows you to enable and store logs in Log Analytics, this is helpful for troubleshooting and performance analysis.
Enabling Log Analytics on CosmosDB
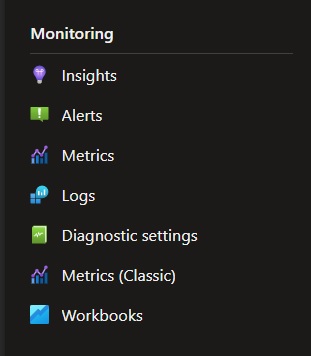
Step 1: Access the Cosmos DB Account and in the left panel go to Monitoring → Diagnostic Settings
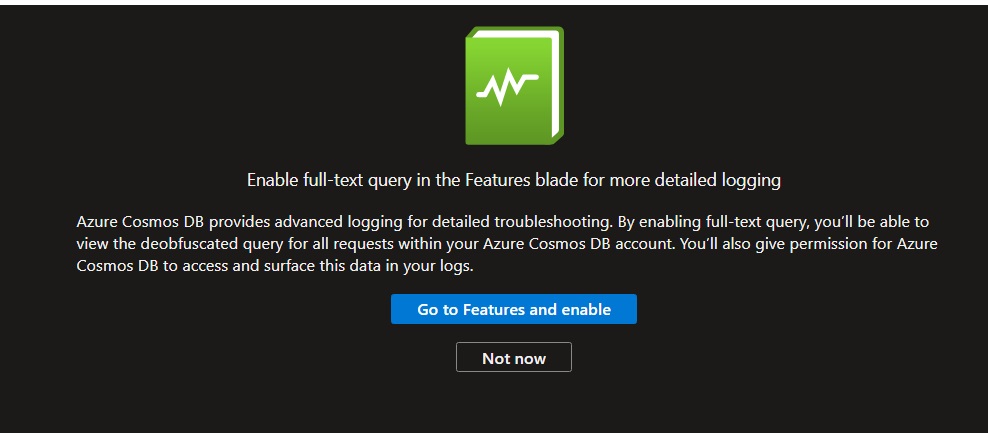
Step 2: A message indicates that if we want to enable “Full Text Query”, let’s click on Not Now
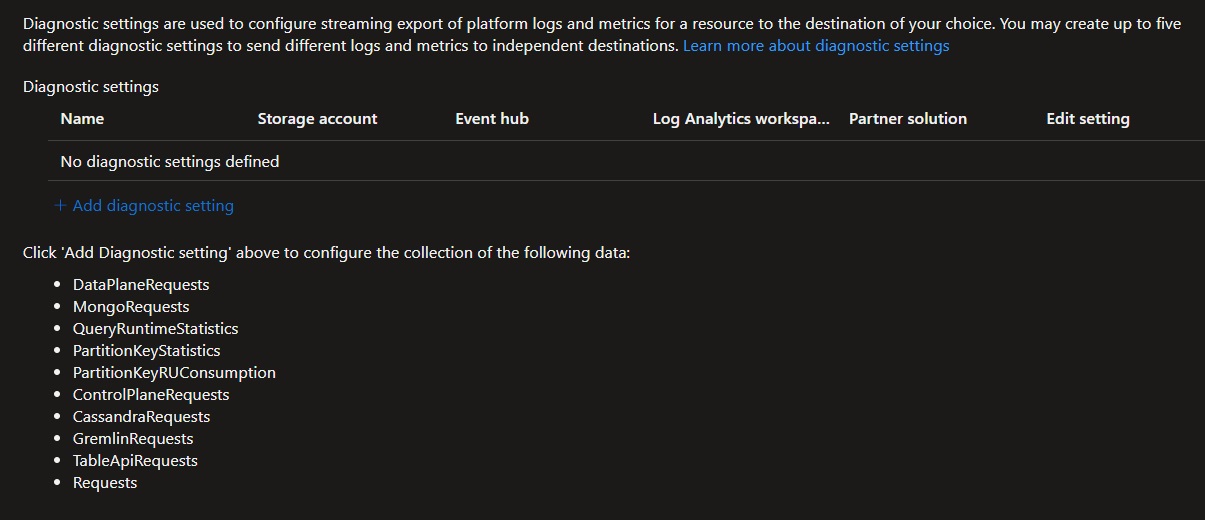
Step 3: If there is no Diagnostics Settings enabled, click on “Add Diagnostic Settings”
Step 4: Select the Logs to store on Log Analytics
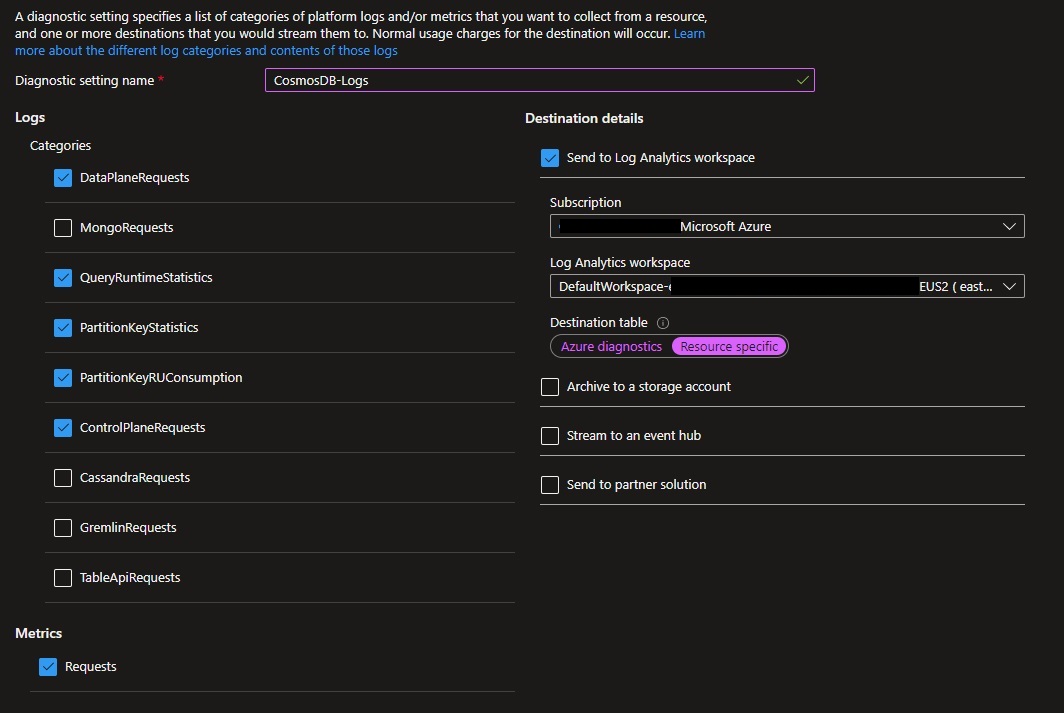
This is the first place where we need to be very careful on the logs that we want to store. I worked with many customers optimizing logs and this is one of the first places where I review.
In my scenario, I am using SQL API, so I don’t need to select the options for Cassandra, Gremlin, Table, or Mongo. If you are using any of those APIs, just select that one.
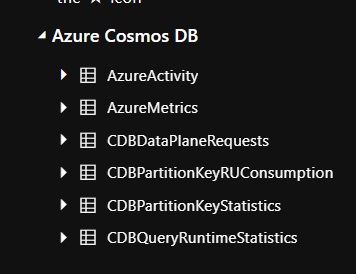
| Category | Description |
|---|---|
| DataPlaneRequest | The DataPlaneRequests table captures every data plane operation for the Cosmos DB account. Data Plane requests are operations executed to create, update, delete or retrieve data within the account. |
| QueryRuntimeStatistics | This table details query operations executed against a SQL API account. By default, the query text and its parameters are obfuscated to avoid logging PII data with full text query logging available by request. |
| PartitionKeyStatistics | This table provides outlier logical partition keys that have consumed more storage space than others, which can be valuable in debugging storage skews. |
| PartitionKeyRUConsumption | This table details the RU (Request Unit) consumption for logical partition keys in each region, within each of their physical partitions. This data can be used to identify hot partitions from a request volume perspective. |
| ControlPlaneRequest | This table details all control plane operations executed on the account, which include modifications to the regional failover policy, indexing policy, IAM role assignments, backup/restore policies, VNet and firewall rules, private links as well as updates and deletes of the account. |
Important: This is an area where we need to be cautious. While keeping those logs is very helpful, they will generate some cost on Log Analytics Workspace (it will depend on the Database usage) but it is important to review the Logs consumption for CosmosDB on Log Analytics.
Here is a query that can be helpful to verify the volume of logs stored:
AzureDiagnostics
| where ResourceProvider == "MICROSOFT.DOCUMENTDB"
| summarize count() by Category
| order by count_ desc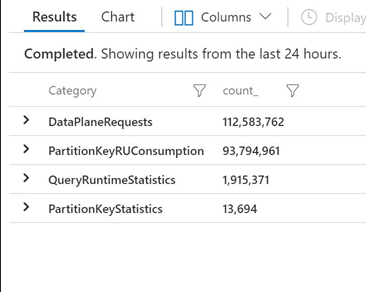
In my example, you can see that on DataPlaneRequest were stored more than 112 Million logs in 24 hours.
Accessing the Logs in Cosmos DB
To access the Logs, there is an option under the Monitoring section on the left panel called Logs.
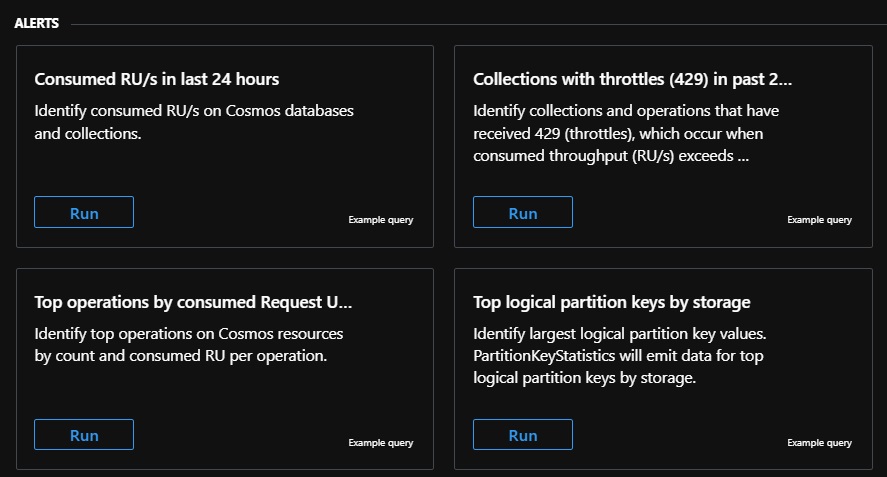
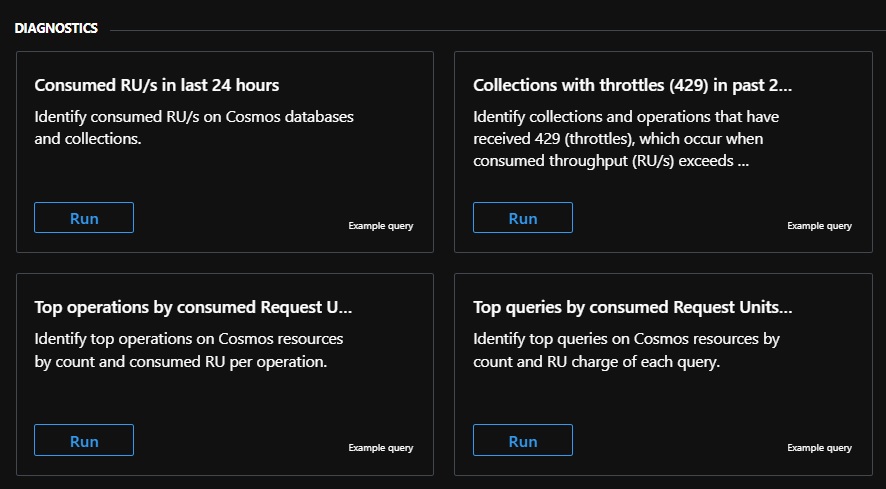
Once accessing Logs, Log Analytics will provide some pre-defined queries.
We can observe a separation between “Alerts” and “Diagnostics”:
For “Alerts” Queries, Cosmos DB presents the following options:
For “Diagnostic” Queries, Cosmos DB presents the following options:
Let’s load the first query presented by Cosmos DB:
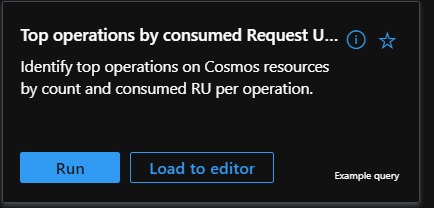
// Top operations by consumed Request Units (RUs) in last 24 hours
// Identify top operations on Cosmos resources by count and consumed RU per operation.
AzureDiagnostics
| where TimeGenerated >= ago(24h)
| where Category == "DataPlaneRequests"
| summarize numberOfOperations = count(), totalConsumedRU = sum(todouble(requestCharge_s)) by databaseName_s, collectionName_s, OperationName, requestResourceType_s, requestResourceId_s, _ResourceId
| extend averageRUPerOperation = totalConsumedRU / numberOfOperations
| order by numberOfOperations
In this query we can see that the category is “DataPlaneRequests”.
The query syntax is KQL - Kusto Query Language.
On the left panel, we can see the Logs available for CosmosDB:
Enabling Full Text Query
By default, Cosmos DB doesn’t enable the full text query. This option helps to improve queries.
Default Logs (without full text query):
Select c.p1, c.p2, c.p3 from c where c.p1="123"Enabling Full Text Query:
Select c.id, c.firstname, c.lastname from c where c.id="123"To enable Full Text Query:
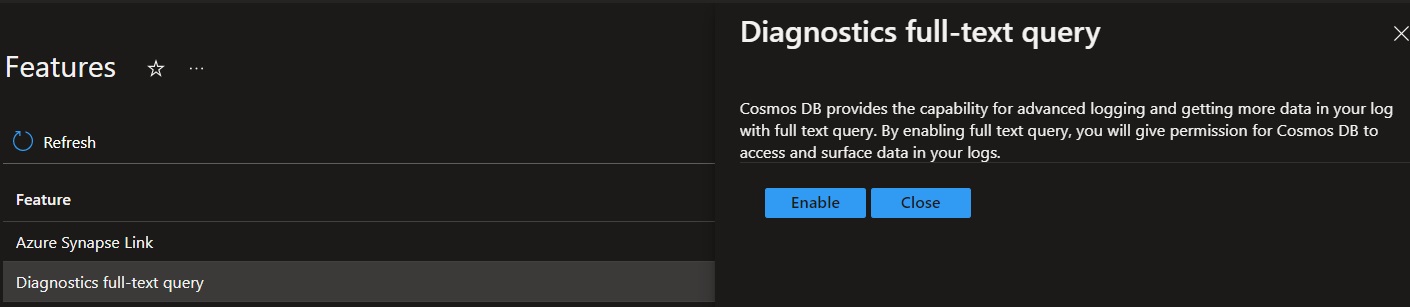
Step 1: Click on Diagnostic Settings one more time.
Step 2: A message indicates that if we want to enable “Full Text Query”, let’s click on Go to Feature and Enable.
Step 3: Click on Diagnostics full-text query and then Enable it.
In a future post I will explain some troubleshooting techniques.