Azure Logs Analytics for CosmosDB
How to enable and use Azure Log Analytics for Cosmos DB. Diagnostic settings, KQL queries, and full-text query logging.
Azure CosmosDB allows you to enable and store logs in Log Analytics, which is helpful for troubleshooting and performance analysis.
Enabling Log Analytics on CosmosDB
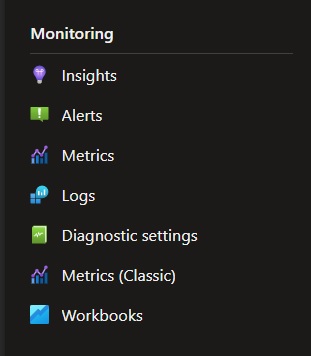
- Access the CosmosDB account and, in the left panel, go to Monitoring > Diagnostic Settings.
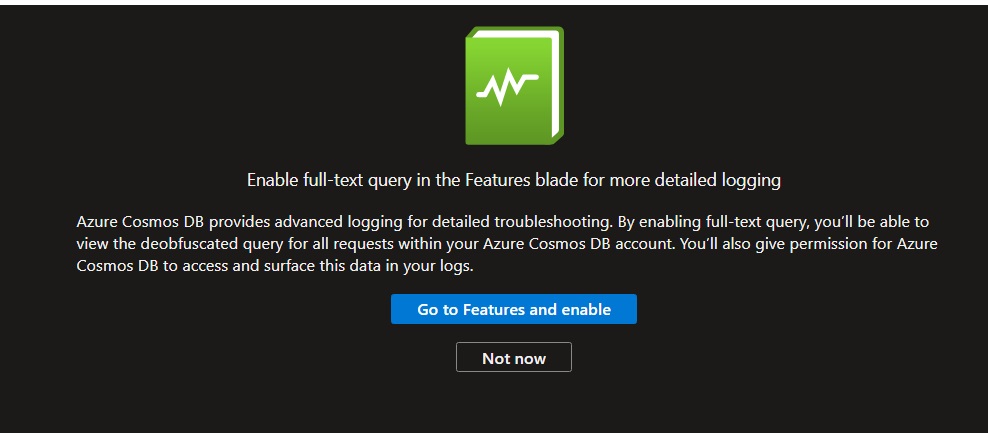
- A message will prompt you about enabling “Full Text Query.” Click Not Now.
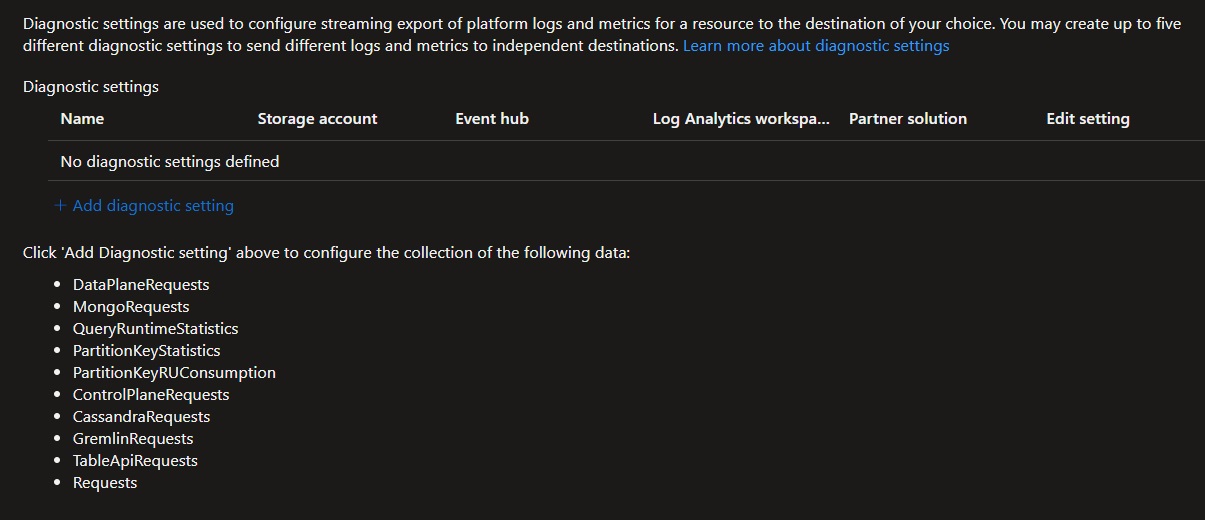
- If no Diagnostic Settings are enabled, click Add Diagnostic Settings.
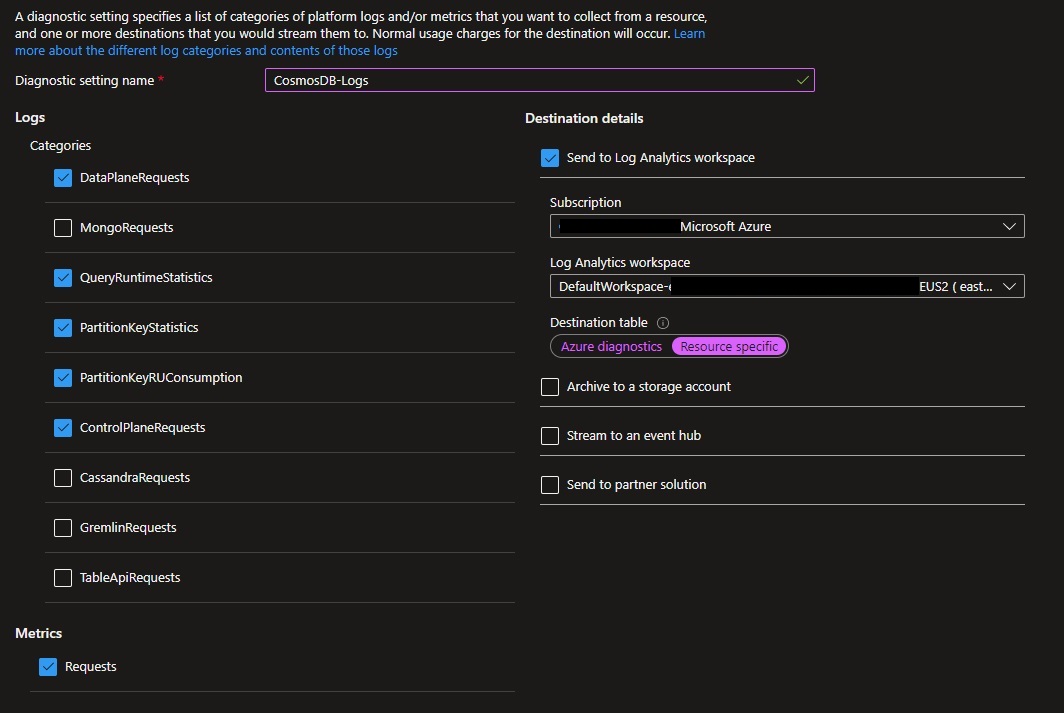
- Select the logs you want to store in Log Analytics.
Key Categories of Logs
| Category | Description |
|---|---|
| DataPlaneRequest | Captures every data plane operation (e.g., create, update, delete, retrieve) for the CosmosDB account. |
| QueryRuntimeStatistics | Details query operations executed against a SQL API account, with optional full-text query logging. |
| PartitionKeyStatistics | Provides insights into logical partition keys with disproportionate storage utilization. |
| PartitionKeyRUConsumption | Tracks RU consumption for logical partition keys in each region and identifies hot partitions. |
| ControlPlaneRequest | Logs all control plane operations, including indexing policy updates, backups, and account modifications. |
Important: While enabling logs is useful, it can incur additional costs in the Log Analytics workspace depending on database usage. Regularly monitor log consumption.
Checking Log Volume
Use the following KQL query to verify log volume:
AzureDiagnostics
| where ResourceProvider == "MICROSOFT.DOCUMENTDB"
| summarize count() by Category
| order by count_ desc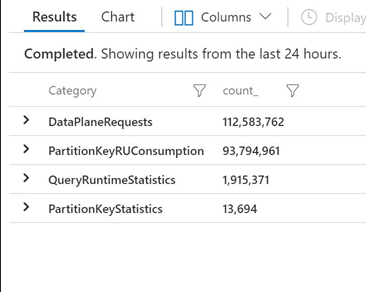
For example, in a 24-hour period, over 112 million logs were stored in the DataPlaneRequest category.
Accessing Logs in CosmosDB
To access logs, navigate to Monitoring > Logs in the CosmosDB account.
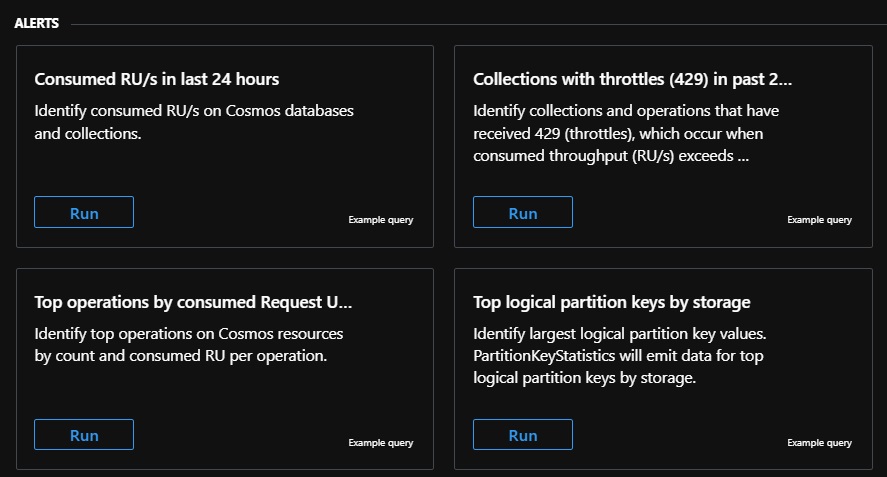
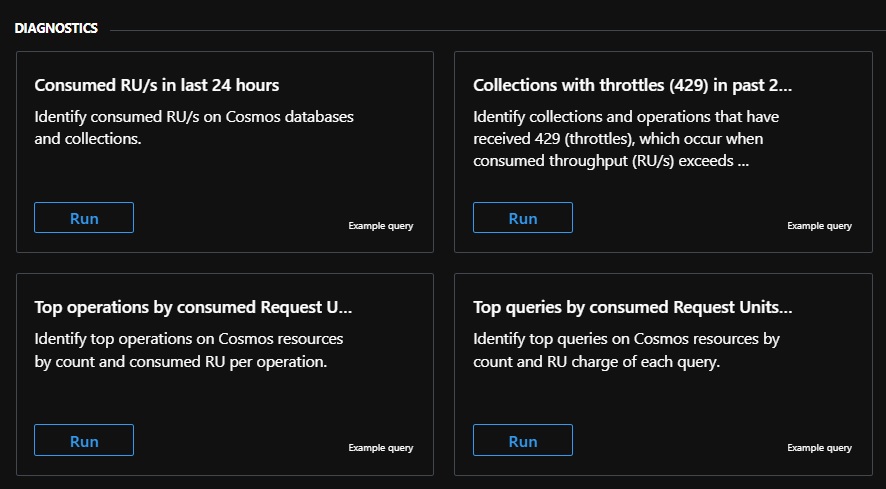
Log Analytics provides pre-defined queries separated into Alerts and Diagnostics:
Alerts Queries
Diagnostics Queries
Sample Query
The following query identifies top operations by consumed RUs in the last 24 hours:
// Top operations by consumed Request Units (RUs) in last 24 hours
AzureDiagnostics
| where TimeGenerated >= ago(24h)
| where Category == "DataPlaneRequests"
| summarize numberOfOperations = count(), totalConsumedRU = sum(todouble(requestCharge_s)) by databaseName_s, collectionName_s, OperationName, requestResourceType_s, requestResourceId_s, _ResourceId
| extend averageRUPerOperation = totalConsumedRU / numberOfOperations
| order by numberOfOperations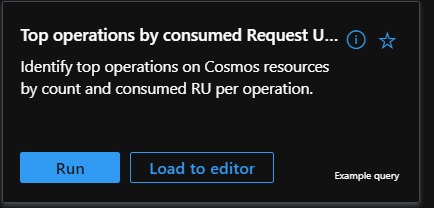
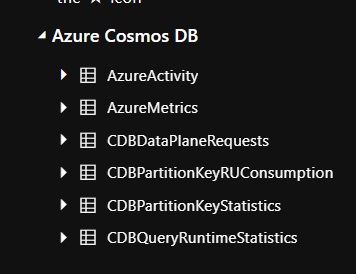
Available Logs in CosmosDB
On the left panel, you can view logs available for CosmosDB:
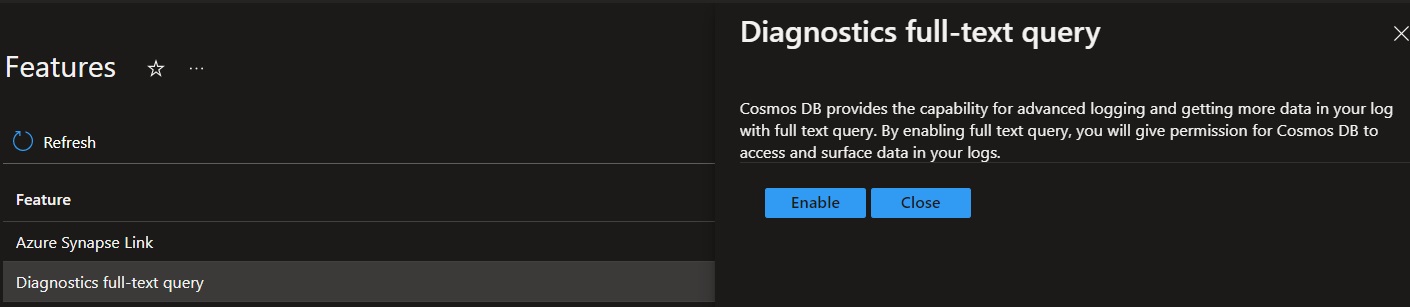
Enabling Full Text Query
By default, CosmosDB does not enable full-text query logging. Enabling this feature improves query visibility.
Comparison
Default Logs (without full-text query):
SELECT c.p1, c.p2, c.p3 FROM c WHERE c.p1="123"Logs with Full Text Query Enabled:
SELECT c.id, c.firstname, c.lastname FROM c WHERE c.id="123"How to Enable Full Text Query
- Navigate to Diagnostic Settings.
- Click Go to Feature when prompted to enable full-text query logging.
- Click Diagnostics full-text query and enable it.
Conclusion
Log Analytics is a powerful tool for monitoring and troubleshooting CosmosDB. Enabling appropriate logs can help identify issues like hot partitions, query bottlenecks, and resource utilization patterns. However, it is crucial to balance the logs collected with the cost implications in Log Analytics. Using targeted queries and insights will maximize efficiency while keeping costs under control.
Future posts will delve into advanced troubleshooting techniques for CosmosDB.